
Not so long ago, a job requirement pushed me into the world of FaaS, and I was thrilled. I had dreams of abstraction -- eliminating all that tedious work no developer likes doing. "We are not operations engineers!" I exclaimed proudly. "We should not need to dabble in the dark arts of the Linux Shell."
But little did I know how wrong I was. We humans are creatures of habit, and one of my habits as an AWS user is checking the AWS Console religiously. It was my central place to monitor everything I needed to know about my servers' health.
Now comes the difficult question: How does monitoring work when using AWS Lambda and Serverless?
Monitoring 101
All applications have metrics we, as developers, need to monitor. This is crucial: downtime and slow apps can create some pretty grumpy customers.
Trust me, I get angry phone calls and rage mail every once in a while. So how can you avoid getting yelled at by customers? Track your errors and monitor your software!
Implement a good notification system that lets you know when and where an error occurred. Make sure to have good and easy to view logs of all errors, warnings and other crucial data your application creates. Be responsible for the software you write. Because it is our legacy as developers. We have made an oath, to be creators of awesome stuff!
But user experience is only one side of the performance metrics. The second crucial metric is the measure of computational resources. How much resources is the app consuming. If it is too much you need to scale down your servers, otherwise, if the app is capping all resources you may consider larger servers or more of them.
Note: I recently came across an awesome article on this topic by none other than the CTO of RisingStack, Peter Marton. He explained in detail how to do monitoring right. I urge you to take a peek, it will change your view on monitoring forever.
Overhead?
Excuse me...? Can I have some monitoring, please? But, without being a burden on my application.
We're lucky that, in 2017, this is a given. Monitoring software has become so advanced that in today's world of programming the overhead is minimal. The sun was not shining so bright back in the day. Monitoring applications was followed by a known fact that it would impact your app's performance significantly.
How does this translate to Serverless?
The Serverless revolution has been gaining strength for the past few years. I see no reason for it to stop. The hype is real.
Developers are starting to view the Function as a Service architecture as a savior, something that makes it possible to scale applications automatically and serve only as many users as needed. The pay-as-you-go method cuts costs drastically and makes it possible for startups to create awesome software for a fraction of the cost.
But, wait a minute. What else needs to be cut for that to become a possibility?
A couple of things come to mind. The overview of your code performance and tracking errors are first. Silent failures as well. How do you monitor the performance of a server that is not a server? Schrödinger's server? Okay, now my head hurts.
This paradox needs a new perspective. Monitoring Serverless is a new beast in itself. Traditional methods will not work. A new mindset is in order.
server != functions
Instead of telling our functions to send along additional data with every invocation, why not just collect their residual data? This is a cool idea! It's a known fact all AWS Lambda functions send their logs to AWS CloudWatch.
Serverless is unforgiving
Unlike in traditional applications, you don't have full overview of every part of your system. Not to mention how hard it is to test Serverless. You have to push code to AWS to see if it's working or spend an eternity on setting up emulators on your local machine. The process is incredibly tedious. Not to start with adding third-party services to your app. It creates overhead and additional costs. Try attaching monitoring services to every single Lambda function. That's never going to scale well!
Let's imagine a scenario of monitoring a simple function on AWS Lambda. The purpose is to test the function and check the verbosity of the logs on CloudWatch.
After hitting the endpoint with Postman a couple of times I'm assured it works fine.

Opening up CloudWatch I can see the logs clearly. All the function invocations are listed.

The logs are extensive, the only issue is I can't seem to make any sense of them. I can see the functions we're invoked, but not much else. Error messages for failing functions are not verbose enough, so they often go unnoticed. I'm also having a hard time finding functions that timed out.
I also tried logging through the command line. It shows possible errors a bit better, but still, not good enough to have peace of mind.
serverless logs -f my-function

Not to mention the tiresome nature of having to push code to AWS every time you'd want to try out something new. Thankfully, all is not lost.
Making my life less miserable
What if I didn't need to push code to AWS every time I wanted to test something? All heroes don't wear capes. Like a knight in shining armor, Serverless Offline comes barging in to save the day! At least now I can test all my code locally before pushing it to AWS. That's a relief.
Setting it up is surprisingly easy. Installing one npm module and adding a few lines to the serverless service's serverless.yml and voila, API Gateway emulated locally to run Lambda functions.
Switching to the directory where I created the sample function and service, I just ran the following command in a terminal:
npm install serverless-offline --save-dev
After installing serverless offline I just referenced it in the serverless.yml configuration:
##############
...
functions:
  hello:
    handler: handler.hello
    ...
    ...
##############
# Added these two lines!
plugins:
  - serverless-offline
Back in my terminal running Serverless offline is as easy as just typing:
serverless offline start
That's it, a local development simulation of API Gateway and Lambda is up and running!
The logs are still bad though...
I still can't get over the fact how bland the logs are. Not to mention the lack of error reporting. I took me a good while to find failing functions in the logs. Imagine the nightmare of tracking them in a large scale production application. This issue is what bothers me to most. The lack of overview. It's like swimming in the dark. I don't have the slightest clue what's down there.
What did I do? I went hunting. There has to be something out there on the web that can help me out. I was looking for a way to simulate the monitoring and logging of a server. I thought maybe there's a way to create a broader perspective over the whole serverless system. What I found blew me away, in a good way. A bunch of tools exist that parse and analyze logs from all functions in a system on the account level. Now that's cool.
I decided to try out Dashbird because it's free and seems promising. They're not asking for a credit card either, making it a "why not try it out" situation.
They say it only takes 5 minutes to hook up with your AWS account and be ready to go, but hey. I'm a skeptic. I timed myself.
The onboarding process was very straightforward. You just add a new policy and role on your AWS account, hook it to your Dashbird account and that's it. They even have a great getting started tutorial.
If you want to know, the timer stopped at 4 minutes. I'm impressed.
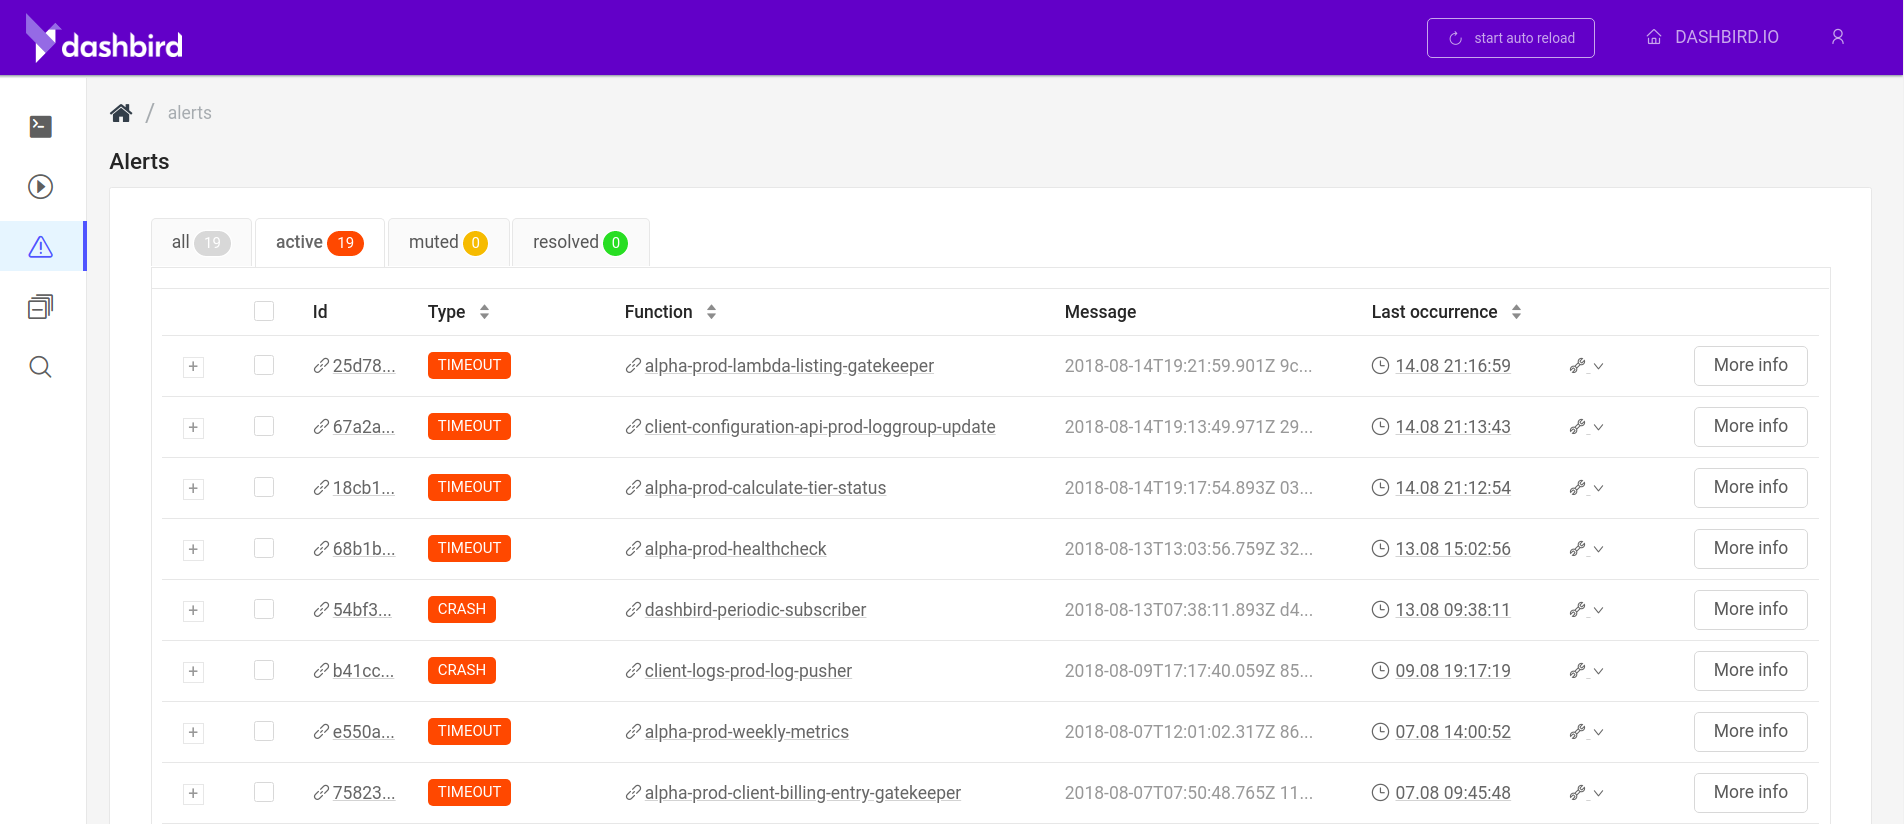
However, I'm much more impressed with Dashbird. I can finally see what's going on.
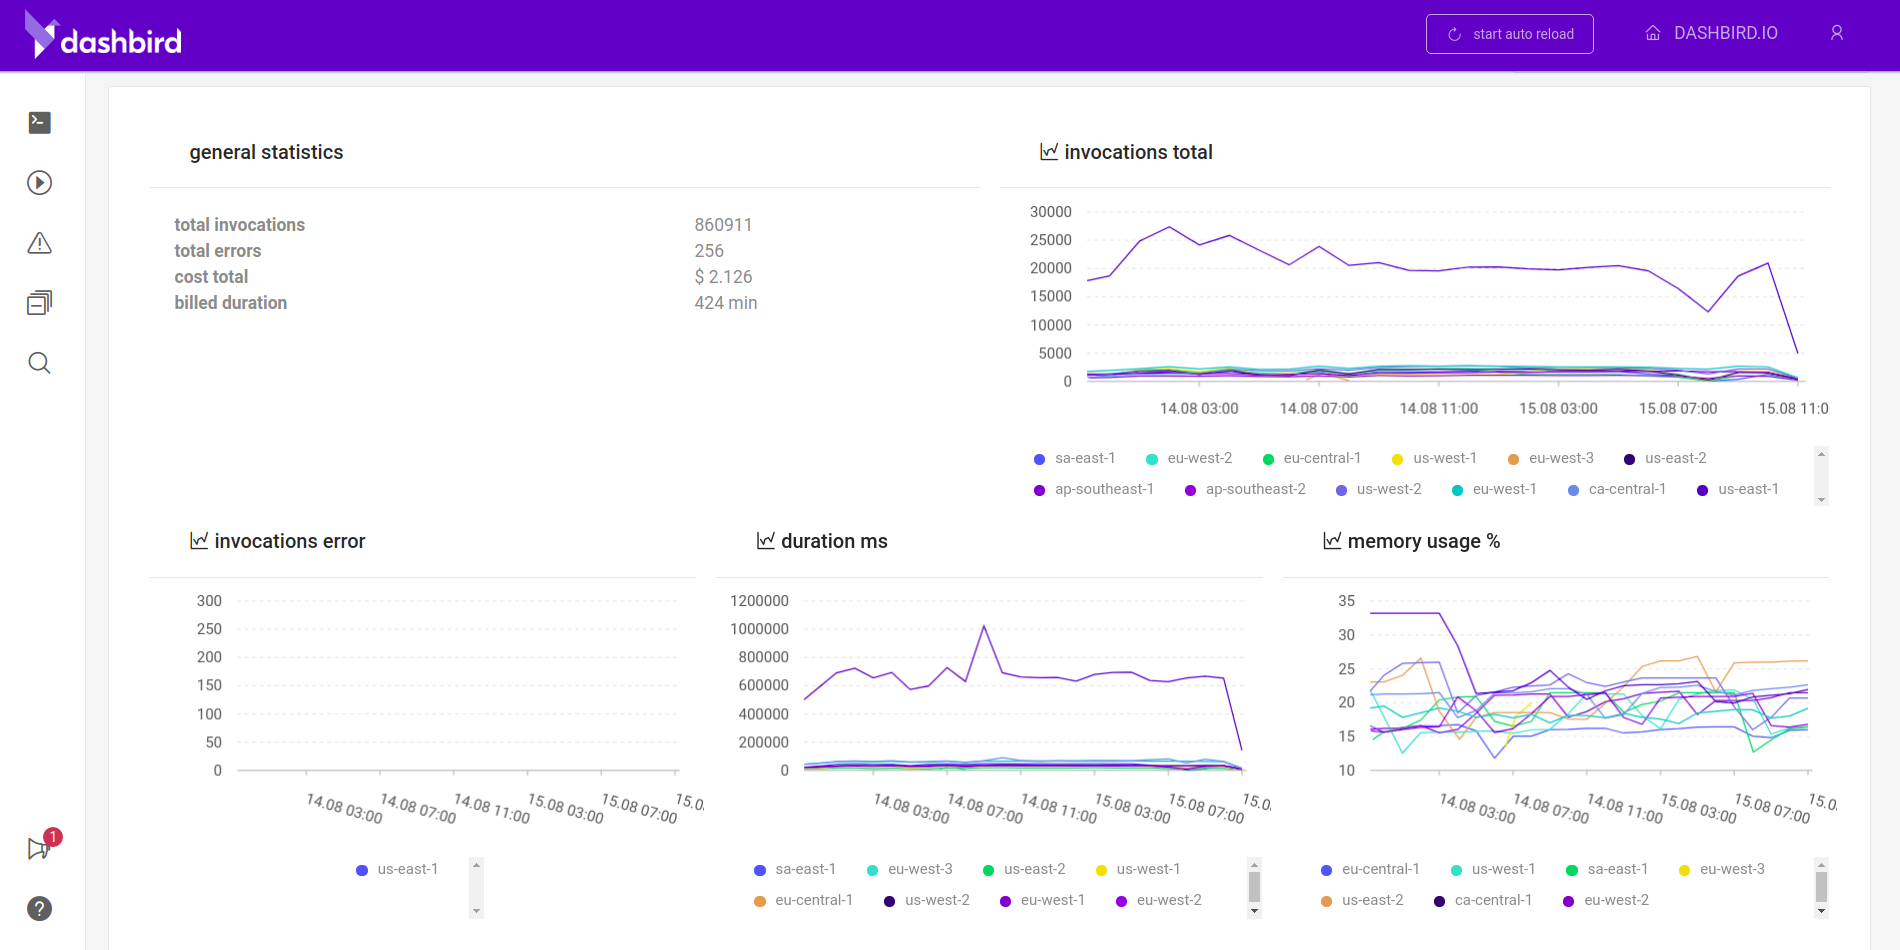
Errors are highlighted, and I can see the overall health of my system. I feel great all of a sudden. It also tracks the cost so I don't blow the budget. Even function tailing in real-time is included. Now that's just cool.
With this watching my back I'd be comfortable with using Serverless for any large-scale application. The word relief comes to mind.
Final thoughts
Whoa... This has been an emotional roller-coaster. Starting out as a skeptic about the ability to monitor and track large-scale Serverless apps, I've turned into a believer.
It all boils down to the developer mindset. It takes a while to switch from the mental image of a server to FaaS. Serverless is an incredible piece of technology, and I can only see a bright future if we keep pushing the borders with awesome tools like Serverless Offline, Dashbird, CloudWatch, and many others.
I urge you to check out the tools I used above, as they have been of great help to me.
Hope you guys and girls enjoyed reading this as much as I enjoyed writing it. Until next time, be curious and have fun.
Do you think this tutorial will be of help to someone? Do not hesitate to share. If you liked it, let me know in the comments below.
Tools:
Resources: